SourceMonitor
published: Thu, 23-Feb-2006 | updated: Sat, 6-Aug-2016
From a post by Dan Miser, I came across SourceMonitor, a rather remarkable tool for developers. It calculates various metrics for source code in various languages, the most important languages for me being C#, Delphi and Java. The breadth of metrics is pretty good too, here the important one for me being cyclomatic complexity. It slices and dices, it's fast, and most impressively of all, it's free.
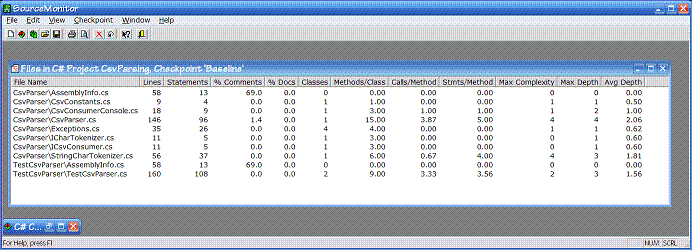
It gathers some nifty metrics for each source file and displays them in a nice table (with the usual sortable, resizeable columns).

Let's see, for each source file it tells you:
- The name of the source file. Well, d'oh. It does give a relative path from the root directory you originally gave the tool when defining the analysis you wanted.
- Number of lines in the source file.
- Number of statements. I think this is the number of lines with compilable code. Lines with braces seem to be excluded, as are comment lines. Yet, I've seen some unexplainable differences between hand-counted statements versus the tool's count so I'm not sure whether I'm not counting them correctly or the tool isn't.
- Percentage of comments. Ho hum. (And only because I tend to believe that comments are not all they're cracked up to be: you should be writing your code more clearly with better-named identifiers, etc.)
- Percentage of document comments. Slightly interesting, but still ho hum. A better one might be "number of class/methods documented" perhaps.
- Number of classes. Interesting in that I try for one class per source file and this lets me know when I fail.
- Average number of methods per class. Not sure whether this one is significant or not. First it's an average, but because I try for one class per source file it ends up as the number of methods in the one class. I suppose one could argue that a class with lots of methods is more complex than it should be, and perhaps that it is a case for refactoring. It could also indicate a class that has been thoroughly refactored to remove duplication (since one way of removing duplication is to use the Extract Method refactoring). So I'm kind of ambivalent about this one.
- Average number of calls per method. Huh? Not sure what this average value would imply to be honest. The more you use Extract Method, the more calls per method you'd get for some methods, and you'd have virtually zero for others. Not even sure what might be the "good" values.
- Average number of statements per method. Kind of interesting. A high value with an overall low complexity might indicate that you prefer lots of sequenced statements, but then again I don't know what that might mean.
- Maximum cyclomatic complexity. 'Nuff said. Joyous meaningful metric.
- Maximum depth. A very intriguing metric this: in essence the maximum level of indentation of your code. This one I've got to monitor. At the moment, for lots of my code this tracks the maximum complexity pretty well: the method that is the most complex tends to be the one that indents the most too. However, I can imagine other cases where this might not be as correlated.
- Average depth. Not sure if this metric is that significant, but hold that thought.
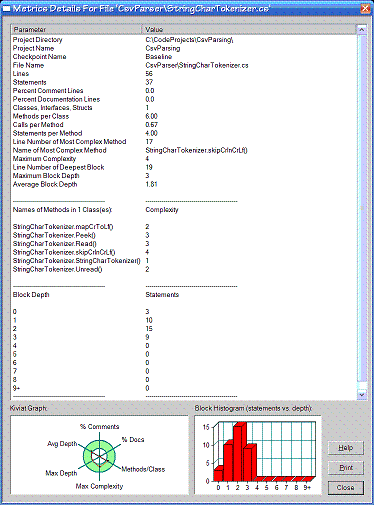
You can then select a particular source file in the table and display another window that shows more detailed metrics.

This new window shows the same metrics as the table did for the selected source file, but also shows you some more:
- Cyclomatic complexity for each method. Just pure goodness.
- Number of statements at each block depth (with a nifty graph). Kind of interesting this one. With my code the graph seems to always show a Poisson distribution: some statements at depth 0, that number rising at depth 1, rising again to depth 2, then falling for depth 3 and again for depth 4, and then a long tail (of mostly zeros).
- Kiviat graph. OK, this one had me stumped, I hadn't come across it before. It's essentially a circular graph with six axes: % comments, % docs, methods/class, max complexity, max depth, and average depth. The graph has a green ring centered on the junction of the axes. I think that the plotted graph for your code should lie within the ring, but annoyingly there's no scale displayed. Some ferreting around enabled me to discover where the axes can be defined on a language by language basis. Sweet. I was able to change the maximum complexity axis for example so that 5 was the maximum (my preference).
Coupled with all this information, you can also rescan your source code as you maintain and refactor it and then you can show trends on how you're doing within the project along the various axes. Double sweet.
I'm definitely going to be using this tool in the future. Well recommended.
